Debugging Verifications with the Test Banner and an LLM
When something goes wrong during a verification — a user gets stuck, reuse fires when it shouldn't, status shows the wrong thing, or just that we need to explain to the user or a vendor what w — the fastest path to understanding is the test banner's Share Context button paired with an LLM that has access to the codebase.
This article walks through how to use them together.
Getting to the Test Banner
The test banner appears at the bottom of every verification screen when nodeEnv is test. It's the thin colored bar that shows the current step name.
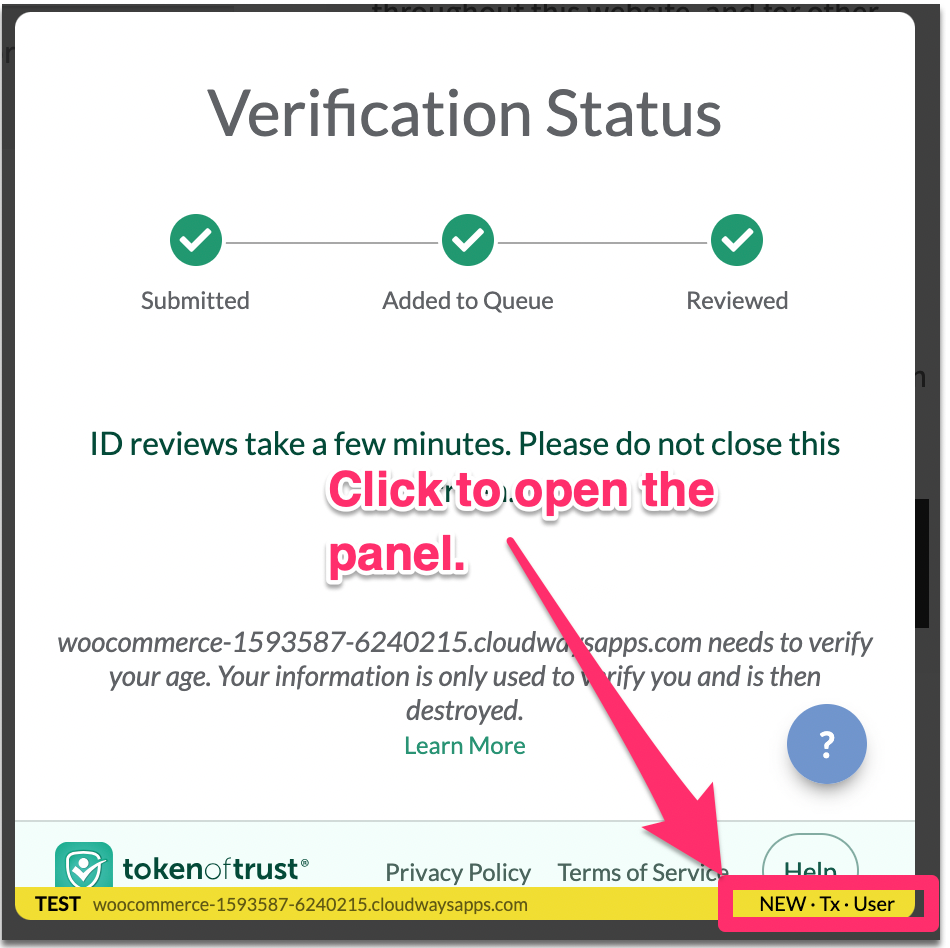
Click the banner to slide up the diagnostic panel.
The panel shows key identity and state fields for the current verification:
- appDomain / appUserid / appTransactionId — the entity identifiers
- sessionUuid — which server session is handling this user
- currentStep — where the workflow is right now
- status — the server-resolved outcome:
NEW,REUSED,BLOCKED, orERR - backendBuild — the git SHA of the running server (so you know exactly what code is deployed)
Each field has a clipboard icon to copy individual values. But the real power is the Share Context button.
Copying the Context
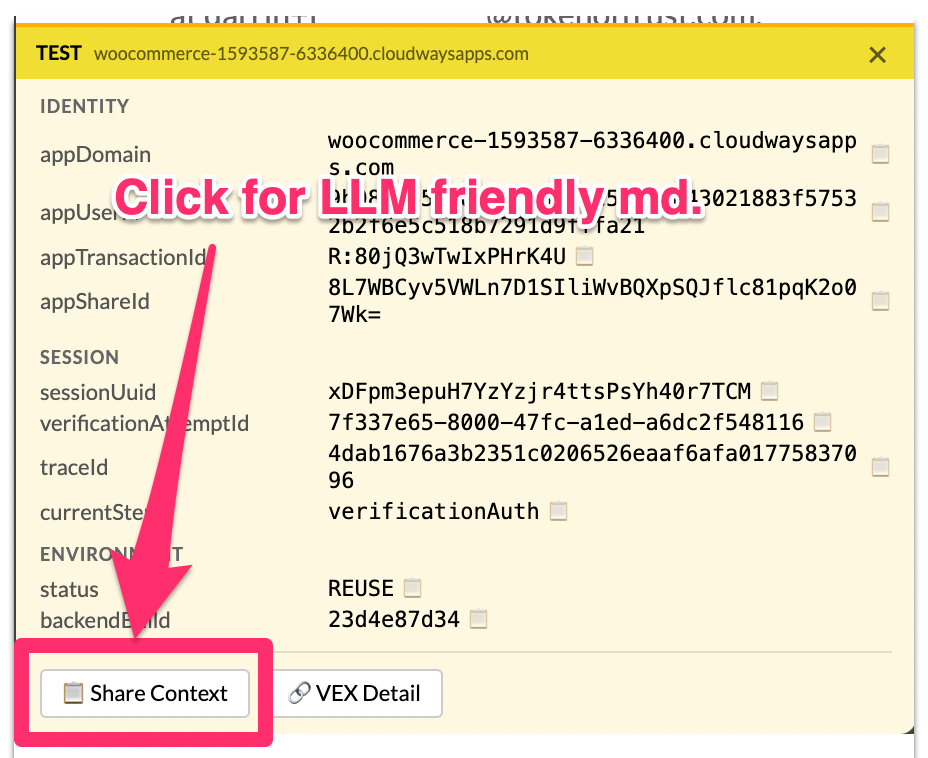
Click Share Context. The button briefly shows ✓ Copied to confirm.
What you just copied is a structured markdown block that looks like this:
## Verification Context

| Field | Value |
|-------|-------|
| appDomain | woocommerce-example.cloudwaysapps.com |
| appUserid | 9cddf3ea16b6842b... |
| appTransactionId | R:QtIZlXGo1EllzjRI |
| sessionUuid | AFDd1vWISg4BDYiJ... |
| currentStep | waitForRealWorldResults |
| status | NEW · Tx · User |
| backendBuild | 438af51973 |
| nodeEnv | test |

### Quick Start

1. `scripts/diagnostics/session.js AFDd1vWISg4BDYiJ...` — live workflow session state
2. `scripts/diagnostics/verification-diag.js 9cddf3ea16b6842b... woocommerce-example.cloudwaysapps.com` — full verification diagnostic
3. `getVerificationTimeline` with appTransactionId — full chronological story
4. `findReputationReport` with appUserid — current reasons/gates
5. `canReuseShare` with appUserid — replay the reuse decision
This block contains everything an LLM needs to start investigating — identity fields, session pointers, and the exact diagnostic commands to run.
Pasting into an LLM
Open your LLM session — WARP, Qodo, or Claude Code with codebase access, or any tool that can run commands against the repo. Paste the context block directly into the conversation along with your question:
The user submitted photos but the status is stuck at Pending. What's going on? Here's my verification context:
[paste the block]
The LLM reads the structured fields and knows:
- Which user and domain to query
- Which session to inspect
- Which diagnostic scripts to run
- What build is deployed (so it can check the right code)
What the LLM Does With It
A good LLM with access to the playbook/investigate-verification.md troubleshooting playbook and the scripts/diagnostics/ tools will:
1. Run verification-diag.js --json
This is the fastest path to a complete picture. One command, one JSON object with everything:
scripts/diagnostics/verification-diag.js <appUserid> <appDomain> --json
The output includes:
| Section | What it tells you |
|---|---|
identity |
Summarized IDs + the canonical verificationCreatedTs for this verification |
statusRows |
How many DynamoDB status rows exist (should be 1), with status and timestamps |
reputation |
Current reasons and gates — is the user cleared? submitted? rejected? |
canReuseShare |
Would reuse fire for this user, and why or why not |
resolution |
How many events resolved a verificationCreatedTs and by which source |
eventProgression |
Every timeline event in chronological order with timing gaps between them — shows exactly what happened and when |
errors |
Any error metrics with details and source |
errorConsole |
Cross-domain _errors partition entries for this user |
metricSummary |
Counts per metric type |
Here's what the event progression looks like — identity and resolution noise stripped by default, timing gaps between events highlighted:
{
  "ts": "2026-04-14T03:47:16.311Z",
  "gapMs": 0,
  "metric": "diag.activity.doAfterInsert.entered",
  "data": {
    "code": "reservation.created",
    "hasAppDomain": true,
    "hasAppUserid": true,
    "hasAppTransactionId": false
  }
},
{
  "ts": "2026-04-14T03:47:16.470Z",
  "gapMs": 152,
  "metric": "diag.activity.doAfterInsert.entered",
  "data": {
    "code": "appData.received",
    "hasAppDomain": true,
    "hasAppUserid": true,
    "hasAppTransactionId": false
  }
}
If you need the stripped fields back (resolvedBy, hintTs, buildSha, identity on each event), add --verbose:
scripts/diagnostics/verification-diag.js <appUserid> <appDomain> --json --verbose
Without --json, the same script outputs a human-readable summary — useful for a quick glance:
STATUS ROWS: 1 ✓ FIXED
  ts=1776138436229  status=Submitted  statusTs=1776138468263

RESOLUTION: 35 events, all resolved via opts

REPUTATION:
  gates: isCleared=fullMatch  isSubmitted=fullMatch  isRejected=-

CAN REUSE: NO (addressMismatch)

ERRORS: 0
2. Run session.js
For workflow-level questions ("why did handleRepeatUser set ERR?", "is the user stuck in a loop?"):
scripts/diagnostics/session.js <sessionUuid>
This shows the live workflow state — current step, step variables (wasRun, handleRepeatUserOutcome, canReuseShareLastReason), appData, and session timing.
3. Check Sentry
For exceptions — the LLM searches for recent issues matching the buildSha and sessionUuid tags. Stack traces in Sentry show exactly which code path triggered an error.
4. Trace the code
Using the backendBuild SHA, the LLM reads the exact deployed version of any file. If you're seeing a bug that was fixed in a later commit, it can tell you immediately.
The Status Field
The status line in the context block is a compact summary:
| Label | Meaning |
|---|---|
NEW |
Fresh verification, no prior history |
REUSED |
Returning user, prior verification reused |
BLOCKED |
Reuse blocked (address mismatch, etc.) |
ERR |
Something went wrong in the reuse/copy flow |
PENDING |
handleRepeatUser hasn't run yet |
The flags after the label (Tx · User) indicate which identity fields are present. If Tx is missing when you expect a transaction, that's a signal.
The VEX Detail Button (Coming Soon)
Next to Share Context, there's a VEX Detail button that opens the Verification Explorer directly for this entity. VEX shows the full verification journey — status history, reasons, gates, documents, and review activity. It's the visual complement to the diagnostic scripts - built for humans.
Reference
- Share Context template — format spec for the copied block
- Verification troubleshooting reference — metric catalog and decision trees
- Investigation playbook — step-by-step procedure
- Diagnostic scripts —
session.js,verification-diag.js,diag.sh